I’ve seen a number of posts where the software generates a shaded overlay that (over time) shows you the entire area that you’ve “seen” aircraft in… the adsbreceiver setup that I have only shows what I think is the “normal” dump1090 map, with the max theoretical range figures built from the heywhatsthat.com information.
I’ve seen a couple of places where the software appears to run on a windows machine, but my setup is raspi and I don’t have a realistic way of getting the information that I want/need other than my pi. Suggestions?
A lighter weight option is to run ModeSMixer2. A version for the Pi can be downloaded from here xdeco.org/
Like VRS and Piaware, MM2 sends its graphical output to a web page. This software is discussed on various forums - just do a Google search for “ModeSMixer2”.
If you use Piaware, ***don’***t use another program from that website call ModeSDeco2 - that captures data from a dongle so it will mess up Piaware!
Edit:
And just remembered that there was an add on that did this for dump1090/Piaware but it was written for Piaware2. That might be the images you saw on this forum. With a change of mapping for Piaware3, it does not work any more
I found getting VRS up and running on my MAC pretty challenging, of course, I don’t know jack. The difficulty was in the various programs you have to load and then run for VRS to run. But, I am glad I did, it is certainly worth the effort! Good Luck.
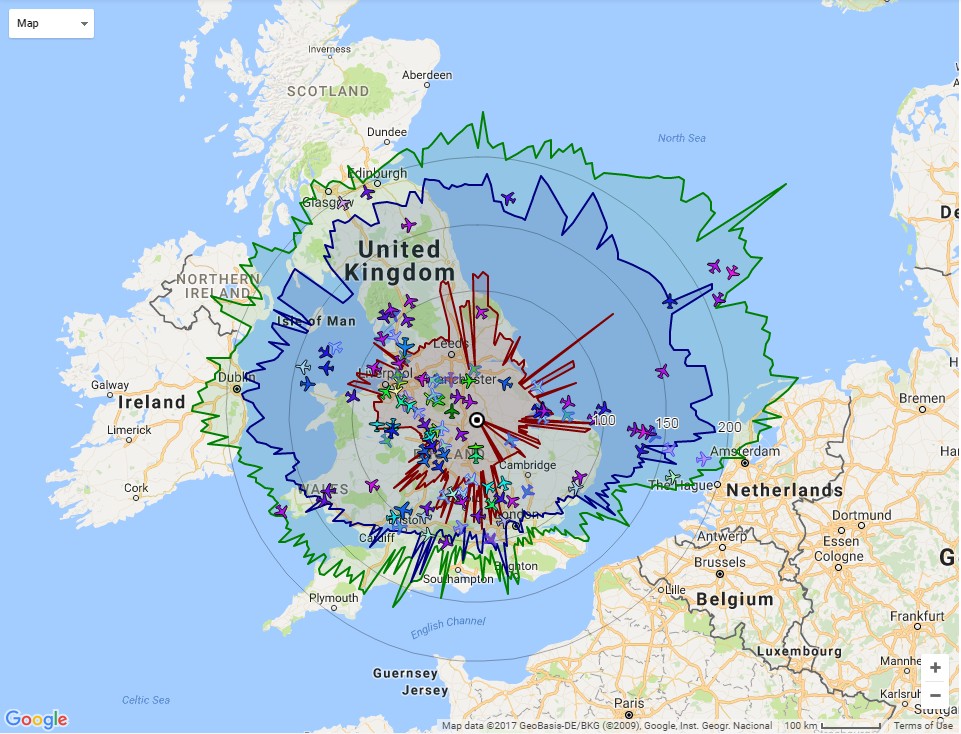
Here is my 30,000 ft heat map.
Note the scarcity of planes today, the NY/New England is hurting my numbers, badly!
