Hi
Just set up my N2 to run the current airspy tweaking but I can’t seem to get the 1090 graphs to work. Installed the relevant 1090 graph script, but the graphs aren’t generating.

Hi
Just set up my N2 to run the current airspy tweaking but I can’t seem to get the 1090 graphs to work. Installed the relevant 1090 graph script, but the graphs aren’t generating.
graphs1090 is getting the data mainly from the system or the json of dump1090/readsb.
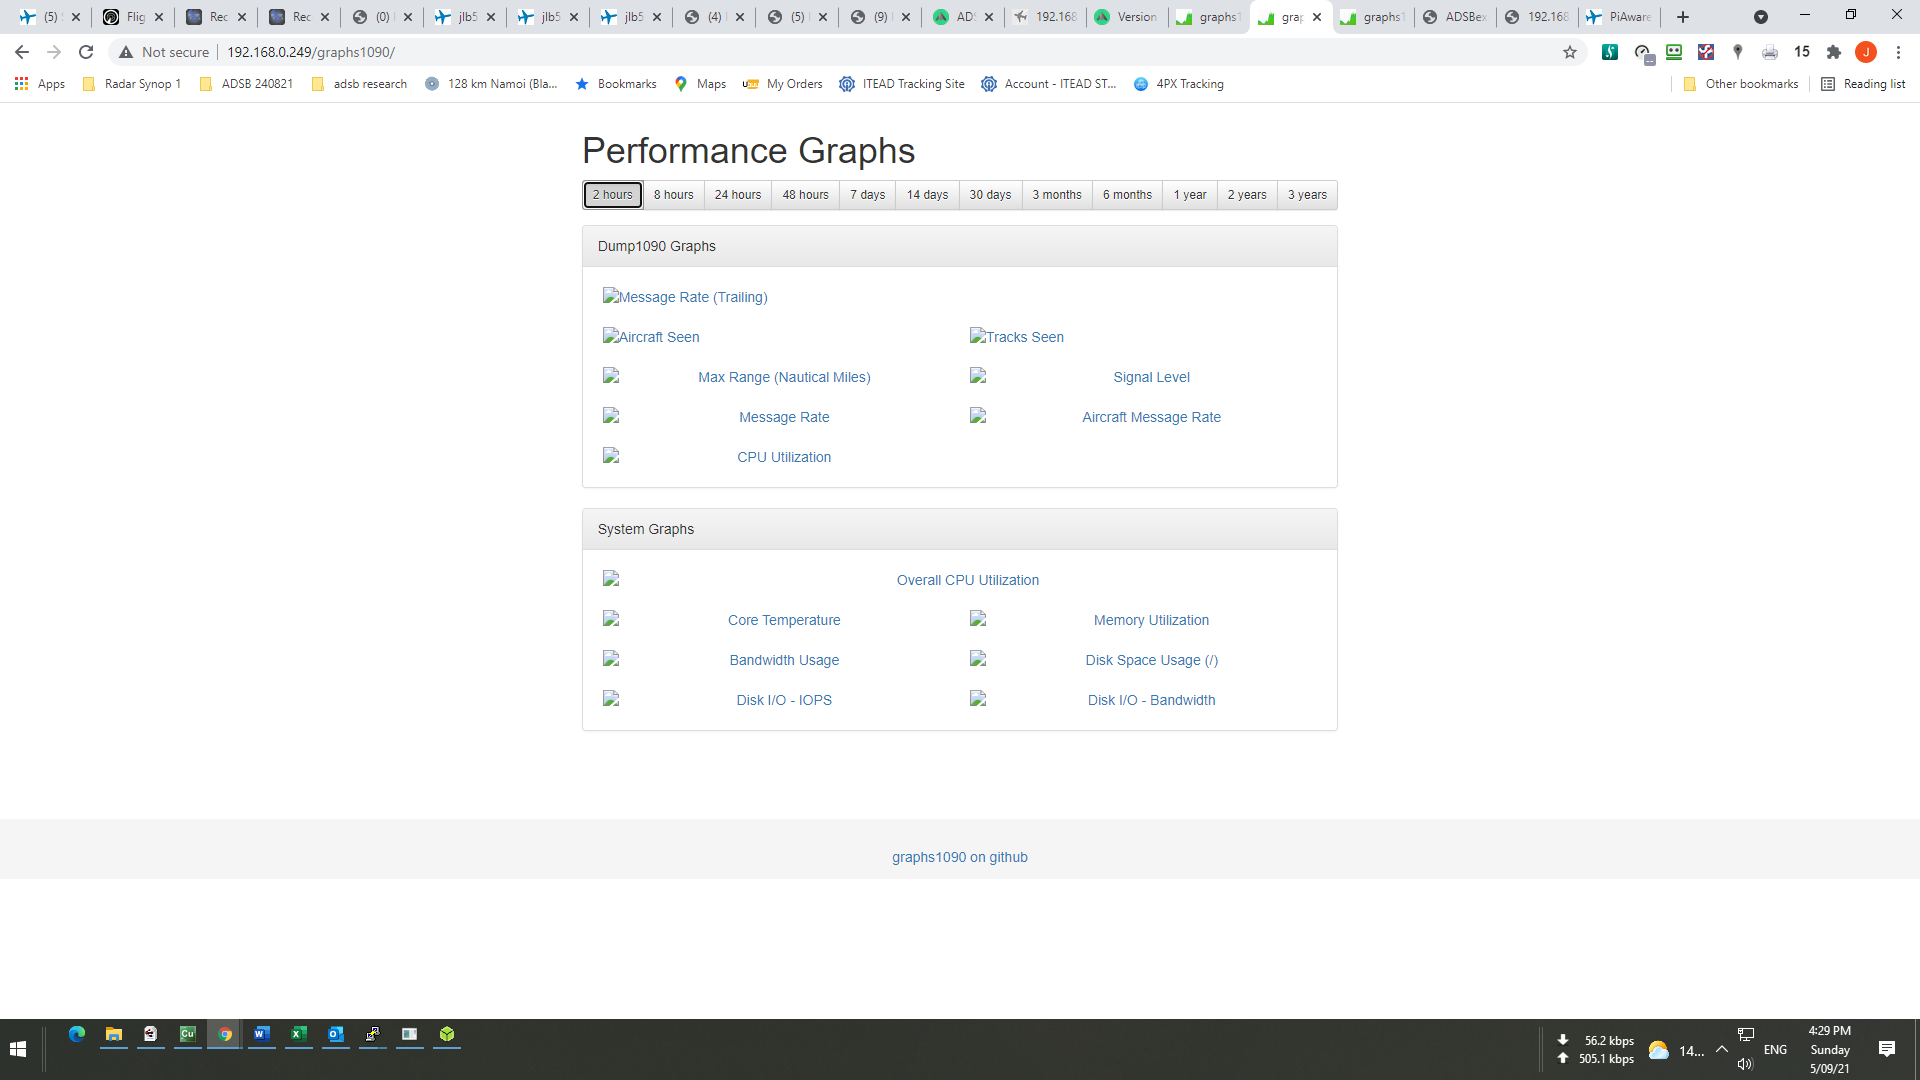
What graphs are exactly missing?
Is collectd installed properly? Any output from the script you installed it with?
odroid@odroid:~$ systemctl status collectd.service
● collectd.service - Statistics collection and monitoring daemon
Loaded: loaded (/lib/systemd/system/collectd.service; enabled; vendor preset: enabled)
Drop-In: /etc/systemd/system/collectd.service.d
└─malarky.conf
Active: activating (auto-restart) (Result: exit-code) since Sun 2021-09-05 16:34:42 AEST; 4s ago
Docs: man:collectd(1)
man:collectd.conf(5)
https://collectd.org
Process: 27514 ExecStartPre=/usr/sbin/collectd -t (code=exited, status=0/SUCCESS)
Process: 27519 ExecStartPre=/bin/bash /usr/share/graphs1090/readback.sh (code=exited, status=0/SUCCESS)
Process: 27532 ExecStartPre=/usr/sbin/collectd -t (code=exited, status=0/SUCCESS)
Process: 27533 ExecStart=/usr/sbin/collectd (code=exited, status=1/FAILURE)
Process: 27534 ExecStopPost=/bin/bash /usr/share/graphs1090/writeback.sh (code=exited, status=1/FAILURE)
Main PID: 27533 (code=exited, status=1/FAILURE)
odroid@odroid:~$
And the original install script:
odroid@odroid:~$ sudo bash -c “$(curl -L -o - https://github.com/wiedehopf/graphs1090/raw/master/instal l.sh)”
% Total % Received % Xferd Average Speed Time Time Time Current
Dload Upload Total Spent Left Speed
100 138 100 138 0 0 359 0 --:–:-- --:–:-- --:–:-- 359
100 8244 100 8244 0 0 11065 0 --:–:-- --:–:-- --:–:-- 1953k
Hit:1 Index of /hardkernel/ppa/ubuntu focal InRelease
Hit:2 Index of /ubuntu focal InRelease
Hit:3 http://ports.ubuntu.com/ubuntu-ports focal InRelease
Hit:4 Index of /n2/ focal InRelease
Get:5 http://ports.ubuntu.com/ubuntu-ports focal-updates InRelease [114 kB]
Get:6 http://ports.ubuntu.com/ubuntu-ports focal-backports InRelease [101 kB]
Get:7 http://ports.ubuntu.com/ubuntu-ports focal-security InRelease [114 kB]
Fetched 328 kB in 3s (122 kB/s)
Reading package lists… Done
Building dependency tree
Reading state information… Done
1 package can be upgraded. Run ‘apt list --upgradable’ to see it.
Reading package lists… Done
Building dependency tree
Reading state information… Done
libpython3.9 is already the newest version (3.9.5-3~20.04.1).
The following packages were automatically installed and are no longer required:
libavresample4 libfprint-2-tod1 libllvm10 libllvm11
Use ‘sudo apt autoremove’ to remove them.
0 upgraded, 0 newly installed, 0 to remove and 1 not upgraded.
remote: Total 0 (delta 0), reused 0 (delta 0), pack-reused 0
From GitHub - wiedehopf/graphs1090: Graphs for readsb / dump1090-fa / dump1090 (based on dump1090-tools by mutability)
All done! Graphs available at http://192.168.0.249/graphs1090
It may take up to 10 minutes until the first data is displayed
That’s the problem.
Follow the instructions as described in the last line
Note: Please for next time use the “code” block for documenting logs here. It’s hard to read otherwise. You can find that in the editor by using “</>” after you marked the text you want to show as code
sorry that was a cut and paste from the SSH window
I am not sure what instructions you refer to?
This one gives you the instructions how to identify the issue:
Excecute these and share the results here
got it stand by xxxx
● collectd.service - Statistics collection and monitoring daemon
Loaded: loaded (/lib/systemd/system/collectd.service; enabled; vendor preset: enabled)
Drop-In: /etc/systemd/system/collectd.service.d
└─malarky.conf
Active: activating (auto-restart) (Result: exit-code) since Sun 2021-09-05 16:34:42 AEST; 4s ago
Docs: man:collectd(1)
man:collectd.conf(5)
https://collectd.org
Process: 27514 ExecStartPre=/usr/sbin/collectd -t (code=exited, status=0/SUCCESS)
Process: 27519 ExecStartPre=/bin/bash /usr/share/graphs1090/readback.sh (code=exited, status=0/SUCCESS)
Process: 27532 ExecStartPre=/usr/sbin/collectd -t (code=exited, status=0/SUCCESS)
Process: 27533 ExecStart=/usr/sbin/collectd (code=exited, status=1/FAILURE)
Process: 27534 ExecStopPost=/bin/bash /usr/share/graphs1090/writeback.sh (code=exited, status=1/FAILURE)
Main PID: 27533 (code=exited, status=1/FAILURE)
– The job identifier is 36067 and the job result is failed.
lines 2799-2821/2821 (END)
Please… write these outputs as code here. This is pretty hard to read.
collectd is not running. the start ended with a Failure
I am not an expert, maybe @wiedehopf can help
That’s the part which is important:
Process: 27533 ExecStart=/usr/sbin/collectd (code=exited, status=1/FAILURE)
Process: 27534 ExecStopPost=/bin/bash /usr/share/graphs1090/writeback.sh (code=exited, status=1/FAILURE)
Main PID: 27533 (code=exited, status=1/FAILURE)
Some further text re the print out
– The job identifier is 33559.
Sep 05 17:05:16 odroid collectd[39629]: copying DB from disk to /run/collectd
Sep 05 17:05:16 odroid collectd[39638]: plugin_load: plugin “syslog” successfully loaded.
Sep 05 17:05:16 odroid collectd[39638]: plugin_load: plugin “rrdtool” successfully loaded.
Sep 05 17:05:16 odroid collectd[39638]: plugin_load: plugin “table” successfully loaded.
Sep 05 17:05:16 odroid collectd[39638]: plugin_load: plugin “interface” successfully loaded.
Sep 05 17:05:16 odroid collectd[39638]: plugin_load: plugin “cpu” successfully loaded.
Sep 05 17:05:16 odroid collectd[39638]: plugin_load: plugin “aggregation” successfully loaded.
Sep 05 17:05:16 odroid collectd[39638]: plugin_load: plugin “match_regex” successfully loaded.
Sep 05 17:05:16 odroid collectd[39638]: plugin_load: plugin “df” successfully loaded.
Sep 05 17:05:16 odroid collectd[39638]: plugin_load: plugin “disk” successfully loaded.
Sep 05 17:05:16 odroid collectd[39638]: ERROR: dlopen(“/usr/lib/collectd/python.so”) failed: /usr/lib/collectd/python.so: und>
Sep 05 17:05:16 odroid collectd[39638]: dlopen(“/usr/lib/collectd/python.so”) failed: /usr/lib/collectd/python.so: undefined >
Sep 05 17:05:16 odroid collectd[39638]: plugin_load: Load plugin “python” failed with status 2.
Sep 05 17:05:16 odroid collectd[39638]: dlopen(“/usr/lib/collectd/python.so”) failed: /usr/lib/collectd/python.so: undefined >
Sep 05 17:05:16 odroid collectd[39638]: plugin_load: Load plugin “python” failed with status 2.
Sep 05 17:05:16 odroid collectd[39638]: Error: Parsing the config file failed!
Sep 05 17:05:16 odroid collectd[39638]: Found a configuration for the `python’ plugin, but the plugin isn’t loaded or didn’t >
Sep 05 17:05:16 odroid collectd[39638]: Plugin python failed to handle option ModulePath, return code: -1
Sep 05 17:05:16 odroid systemd[1]: collectd.service: Main process exited, code=exited, status=1/FAILURE
check that python is installed properly on the device
Try the install script again.
Yes I shall try again, do I need to uninstall it first?? I did have a look at the non standard config section in regards to not finding the graphs and that it mentions “/etc/collectd/collectd.conf’” but it cant find that collectd.
Hmm another error on the install script
Install in progress, this shouldn’t take longer than a minute or two …
Job for collectd.service failed because the control process exited with error code.
See “systemctl status collectd.service” and “journalctl -xe” for details.
ERROR on line number 222
And try once more in 2 minutes or so.
Job for collectd.service failed because the control process exited with error code.
See “systemctl status collectd.service” and “journalctl -xe” for details.
ERROR on line number 235
Another error, different line.
For you info though, the airspy script fresh install worked a charm, installed 2.2 RC3
The only difference from it installing previously with no issue, is that I tried Ubuntu for the first time, only because I have a N2+ on the way and it is the “home” OS for hard kernel