Could you show me the outputs of those two commands?
sudo /usr/share/graphs1090/graphs1090.sh 24h
ls /var/lib/collectd/rrd/localhost

Could you show me the outputs of those two commands?
sudo /usr/share/graphs1090/graphs1090.sh 24h
ls /var/lib/collectd/rrd/localhost
pi@piaware:~ $ sudo /usr/share/graphs1090/graphs1090.sh 24h
15823 (process ID) old priority 0, new priority 5
619x324
619x324
619x324
619x324
1065x328
619x324
619x324
619x324
619x324
ERROR: No DS called ‘tx’ in ‘/var/lib/collectd/rrd/localhost//if_octets.rrd’
619x324
619x324
1122x328
619x324
619x324
pi@piaware:~ $ ls /var/lib/collectd/rrd/localhost
aggregation-cpu-average df-root disk-mmcblk0 dump1090-localhost interface-eth0 memory table-localhost
Should be fixed.
Just run the install again and wait for the graphs to update.
Out of curiousity, what does this command say for you:
ip link
(Just checking if i missed any common network interface names)
pi@piaware:~ $ ip link
1: lo: <LOOPBACK,UP,LOWER_UP> mtu 65536 qdisc noqueue state UNKNOWN mode DEFAULT group default qlen 1000
link/loopback 00:00:00:00:00:00 brd 00:00:00:00:00:00
2: eth0: <BROADCAST,MULTICAST,UP,LOWER_UP> mtu 1500 qdisc pfifo_fast state UP mode DEFAULT group default qlen 1000
link/ether b8:27:eb:47:66:f3 brd ff:ff:ff:ff:ff:ff
pi@piaware:~ $
Ah i guess you disabled wifi?
Anyway hope it works now ![]()
Yes I think I did. Initially I tried using a WiFi dongle that worked for me before on the RPi with OSMC (Open Source Media Center) but it would not work with PiAware. Luckily my router is nearby so a cable connection was easy.
Just to confirm that this is the proper command to reinstall:
sudo bash -c “$(wget -O - https://raw.githubusercontent.com/wiedehopf/graphs1090/master/install.sh)”
That was copied from a post upthread by abcd567 which seems to have disappeared.
Installation and configuration are described on github: GitHub - wiedehopf/graphs1090: Graphs for readsb / dump1090-fa / dump1090 (based on dump1090-tools by mutability)
Thank you and that fixed the ‘Bandwidth Usage’ graph.
The rrd databases get written to every minute, this adds up to around 100 Megabytes written per hour.
Per default linux writes data to disk after a maximum of 30 seconds in the cache.
Increasing this to 10 minutes reduces actual disk writes to around 10 Megabytes per hour.
Don’t change this if you handle data on the Raspberry Pi which you can’t lose the last 10 minutes of.
Increasing this write delay to 10 minutes can be done like this (takes effect after reboot):
sudo cat >/etc/sysctl.d/07-dirty.conf <<EOF
vm.dirty_ratio = 40
vm.dirty_background_ratio = 30
vm.dirty_expire_centisecs = 60000
EOF
It’s not that critical though modern sd-cards should handle that amount of written data for 5 years easily ![]()
Hi
I have followed the installation instructions but when I try to view the graphs I get ‘404 - Not found’ error message. I’ve rebooted my Pi several times but still the same. I’m using a Piaware SD card image.
Any thoughts?
Thanks
What is the output of those two commands?
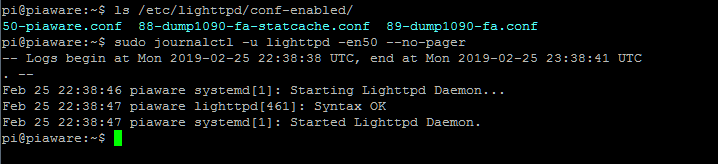
ls /etc/lighttpd/conf-enabled/
sudo journalctl -u lighttpd -en50 --no-pager
What exactly did you install and how?
Did the installation give you some error?
I used this command:
sudo bash -c "$(wget -O - https://raw.githubusercontent.com/wiedehopf/graphs1090/master/install.sh)"
I didn’t notice any error as it went through
Let’s see if anything is there:
ls /usr/share/graphs1090
Maybe lighty-enable-mod doesn’t work?
Try this:
sudo lighty-enable-mod graphs1090
I get the following:
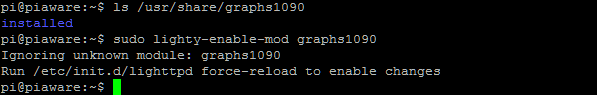
Should I try the Run command as suggested?
Run the install command again and let’s see the output this time ![]()
Yeah seems unzip is not installed.
sudo apt-get install unzip
Then run installer again.
Interesting.
Are you still on a jessie image?