I finished building the 1st cut of my LNA. It tests just fine, and I’ve cut it into my system. I want to show the LNA and it’s relative performance, and then show the graphs1090 changes when I cut over to the new LNA.
The LNA
First the LNA overview (without trying to get into an electronics design discussion):
The goals were an LNA with the inputs and outputs facing the same direction so it could be mounted with the connectors facing down.
The LNA can be powered from the feed line, with any voltage from 4 to 15 volts. There is a small switching supply on one side of the PCB that makes 5V, and then on the top of the board a low noise Low Drop Out (LDO) regulator that makes the 4 volts for the LNA chip.
SAW Bandpass filter before and after the Low Noise Amplifier (LNA). They can be unsoldered and jumped to remove them.
Attenuator after the LNA to determine if the SAW filter pass characorisis are affected by impedance miss-match
The bottom of the PC board with the switching supply looks like this:

The top of the board with the LNA looks ike this. The circuitry is about the same width as a U.S. dime (about 18mm for my global metric friends). There is the ability to put a shield over the entire RF and 4V LDO:

Here is a wide range sweep of the LNA showing its pass band and to what degree it attenuates out of band signals:

Keep in mind that the dark blue Flight Aware USB radio dongle has a SAW filter after it’s LNA, so the final system results w/r/t the passband shape is the same as with my LNA. Note the violet trace- you can see a “bump” that looks like the top of the passband. This makes me think that the LNA is able to operate a bit (maybe 6 dB?) below the noise floor of the spectrum alalyizer, which is at -120 dBm.
One option is to remove the SAW filter before the LNA and use the most excellent Flight Aware 1090 filter. Apologies for not thinking ahead and sweeping that so it was all in the same screen picture, but here is what that filter looks like over the same frequency range:

The SAW filter is narrower, but for the purpose of attenuation out of band frequencies in the 500 to 800 MHz range, both provide a bit more than 50 dB attenuation. In my environment, I will have some interference in the 915 MHz ISM band, so with the SAW filters doing better there by 16 dB or so I would go with the SAW. Since a SAW filter is more delicate than the Flight Aware filter, for most people I would go with that Flight Aware. I plan to build one LNA without the 1st saw filter in case once this LNA is outside up in the air with the antenna it fails. One last metric: the LNA chip itself was only 12°F warmer than ambient. So I’m not worried about the chip getting so hot when it is outdoors that the noise performance declines drastically.
The experiment with the attenuator shows that the SAW filter bandpass characteristics do not change with impedance mis-matches, so I will take the attenuator out of the next board spin. The first board, with that attenuator removed, showed a net gain of about 14.5 dB. This makes the board a good candidate for being placed with the antenna so that any cable losses are compensated for. I hope to get some time on a Noise Meter at a local RF group so I can get a feel for how good the LNA really is. It’s hard to justify buying a noise meter just to debug one LNA and I’m pretty good at justifying buying test equipment. ![]()
The board goes into a 3D printed chassis with spaces to support the board, This plastic chassis will go into a die cast zinc chassis with holes for the two feed lines, and screening to keep out insects.I plan to conformal coat the final PCB (and hope that doesn’t change it’s characteristics , something else to learn…). The die cast zinc chassis will be painted white. A very short (1 meter) feed line will go from the antenna to the LNA.

The Change-Over
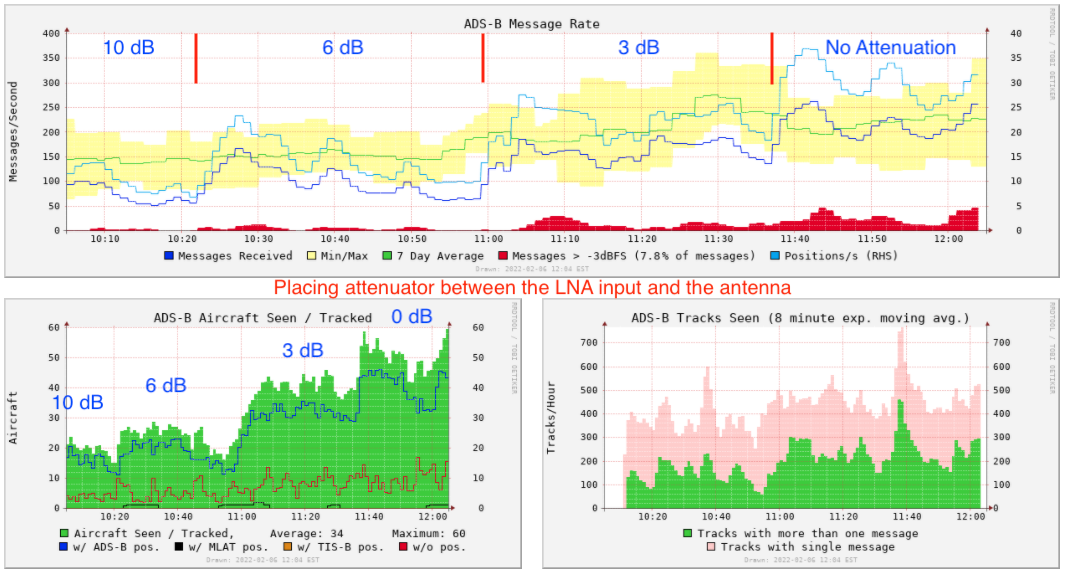
About 11:00 AM local time, I cut in the new LNA. While I’ll check out the Flight Aware page after 24 hours to see compare results, and then in a week to check the daily changes, here are screen shots from graphs1090.
Note that at around 8:00 AM local you can see a peak of messages as all the various commercial airlines from RDU airport (Raleigh-Durham, NC) start the day. There is also a bit of a peak (I’ve seen this on many multi-day graphs) around noon with transfers, and there will be a peak in the evening the flights get in.
The two screen shots of the graphs:

Seems clear things did not get worse. Note the change on the “ADS-B Signal Level” after the change around 11:00. The noise level goes up because with this gain, there is more noise due to signals received that were still too weak to be decoded.
Next Graph set:

The first thing to see here is that prior to my installing the LNA, my gain was maxed out at typically 49. With the 14.5 dB net gain of the LNA, the automatic gain quickly adapted and went down to about 30. I absolutely love the automatic gain of the Flight Aware stick !
There appears to be an increase in the message rates. Time will tell if that is an actual improvement or if it was just a busy Friday travel day.
Note also that with LNA adding gain to the signal such that the Flight Aware stick was not at it’s maximum gain could also mean there is really no discernible improvement in the noise floor, it’s just the improvement in gain allow the stick to receive and decode more messages. The two metrics of an LNA, improving the signal to noise ratio of a signal and providing gain, are often challenging to comprehend.
And here we see the dilemma for everyone trying to optimize their system. The received signals are constantly changing due to different amounts of aircraft in the air, and due to different weather conditions. So while it’s easy to look at a specification for pieces of the systems (Filter, LNA, Coax), and easy to measure the performance of a given component on a piece of test equipment, in the real world it can be very difficult to determine if things got better or worse.
I took screens shots of graphs1090 from a week ago before cutting in the LNA, and will look again in about a week. I will also look at the coverage charts and daily report of Aircraft Reported on the Flight Aware page for my account. Hopefully that will give me some feel for what the change in performance is with this LNA. At this point, I plan on keeping it, I am working on an outside antenna site, and when that is ready I can see how the LNA holds up when it is outside. The simplicity of just two connections with the LNA, and a metal box that is very small are quite compelling here.
I hope the LNA pix are at least interesting. There have been a lot of posts on how to evaluate performance, so I hope this will help with peoples understanding of that process. I look forward to comments on how people interpret the graphs, ideas for measuring performance and other comments. I’ll add on to this post in a week with the Coverage Graph and Aircraft Reported information from my Flight Aware account so we can see if that helps when trying to determine if a system change has helped out and if so by how much.
Long post, sorry, hope it is informative, looking forward to feedback !