so i know jack about RF and dB, but trying with this tool to optimize gain/ppm settings
for my dongle RTL-SDR v3 and 6.8cm antenna indoors by the window, 3d floor, 1.5nm NE from CYUL.
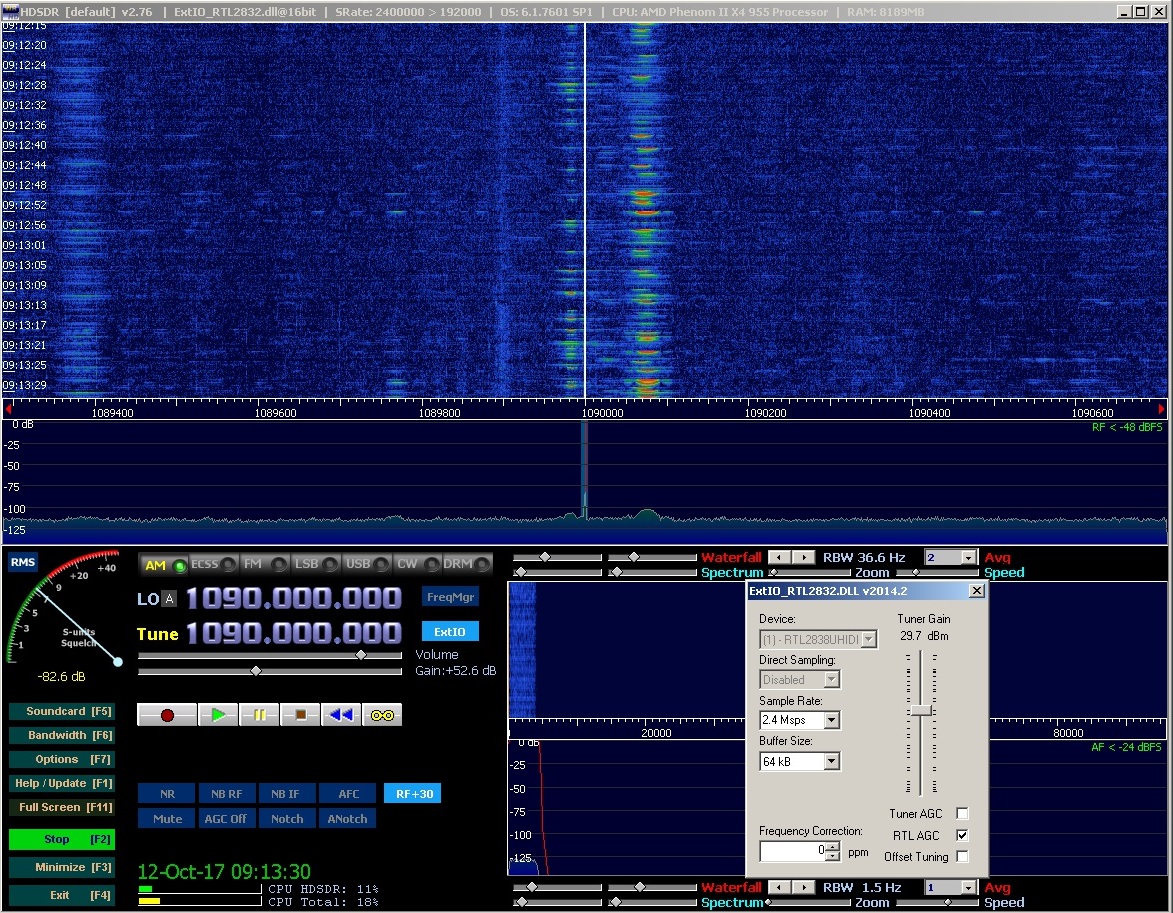
i like to ask the RF pros here, how do i interpret these HDSDR images, taken over short time period ?
a. which gain setting appears best ?
b. which image shows the most noise ?
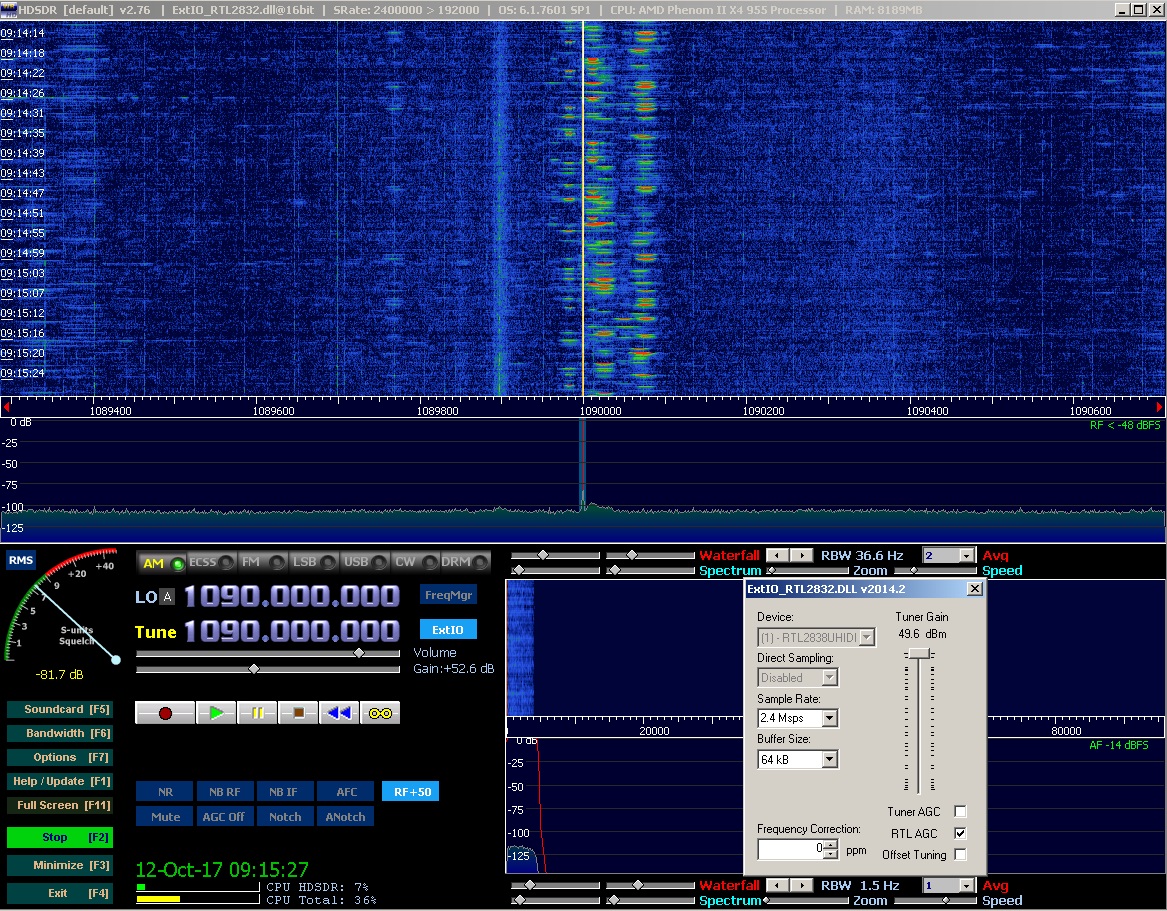
c. what these numbers mean, what i am looking for ? (last image 49.6 gain 1,2 and 3)
ie is -48 better or -52 better ?
d. ppm is at 0, do i need to put the red-green ‘targets’ under the white line (center) ?
e. any suggestions ?
thanks if you bothered reading this, double thanks if bothered answering
You can’t really answer most of those questions from a waterfall display. The best thing to do is to actually try different gains and see which gives you the best range / message rate.
For dBFS values, more positive is stronger (-48 is stronger than -52). Whether it’s better depends on what you’re measuring.
You can’t really answer most of those questions from a waterfall display. The best thing to do is to actually try different gains and see which gives you the best range / message rate.
yes, but what is the visual cue i am looking for ? brighter / stronger echoes ? wider echoes ?
There is no visual cue; as I said, waterfalls aren’t good for this. Run your ADS-B decoder at different gains and look at the resulting range / message rates.