Thoughts on optimizing gain

If I take my ADS-B box to a nearby airport to watch planes land, will the -10 Max AGC setting adapt to the stronger signals from landing aircraft or will I need to manually reduce the GAIN setting?

I’m not using an LNA, just a dongle and DIY 1/4 wave antenna.

No it won’t adjust properly.

Better reduce it manually.

here is a nice post from obj about agc from 2015

objFlightAware Staff

May '15

It’s pretty horrible actually…

The R820T tuner has three gain stages: LNA, mixer, VGA.

If you ask librtlsdr for a manual gain value (or “maximum”, which picks the largest manual setting) there is a table that sets fixed gains for each stage based on the requested total gain.

Setting --gain -10 asks librtlsdr to use automatic gain settings in the tuner. For a R820T tuner, librtlsdr uses these settings:

  • LNA gain is set to be controlled by the tuner’s AGC
  • Mixer gain is set to be controlled by the tuner’s AGC
  • VGA gain is set to a fixed value

The tuner’s AGC (in hardware) samples the input power (probably at the tuner output? I can’t remember…) and adjusts the LNA/mixer gain based on that. Unfortunately it is not well suited to ADS-B traffic (which has short bursts and highly variable power levels), it’s designed more for DVB-T signals (continuous signal, stable power level). So what usually happens is that the tuner’s AGC sees what seems to be a very weak signal and so sets LNA / mixer gain to maximum.

So the net effect is that “–gain -10” actually sets a fixed gain (!)
The reason that it can produce better results than the maximum manual gain used by librtlsdr is that the VGA gain setting used in AGC mode is slightly higher than the maximum value you can set with a manual gain (this is arguably a bug, you should be able to access this gain setting manually)

So you should interpret “–gain -10” as something more like “–gain 55” (I can’t remember the exact value, it’s a little higher than the usual maximum of 49dB)

1 Like

@wiedehopf , can you enhance the gain button on SkyView so your auto-gain script is one of the dropdown list choices?

It would also be nice if there were several AUTO choices so people that want maximum distance/aircraft could choose AUTO 5% (1-5% msg >-3dB) and people that want no close/strong signals dropped could choose AUTO 50%, etc.

Making sure the gain isn’t set too high would actually mean a lower percentage.
You can already edit the textfile /etc/default/dump1090-fa-autogain
Set a lower and upper threshold.

The way it’s set up dump1090-fa-autogain requies root, gain.php does not and should not have root.

Anyway you can just run it manually via the console as often as you like.

sudo dump1090-fa-autogain

But if you have the dropdown menu already just look at the RSSI and adjust gain manually.
It’s not that complicated.
Just go for the fullscreen table, RSSI is shown there.
You sort by it with the -3 -4 -2 numbers at the top.
Then you reduce gain until the biggest number is -5. (biggest number as in closest to zero)

Is this part of your “graphs for dump1090” script? I haven’t added that to my PiAware 3.7.1 Raspi yet.

No, the bog standard dump1090-fa.

Click on expand sidebar:
Screenshot%20from%202018-12-16%2010-44-54

Click the column head of RSSI twice so the numbers closer to zero are first:
Screenshot%20from%202018-12-16%2010-46-24

See also this post to display RSSI in the sidebar:
Announcing PiAware 3! (Latest version: 3.8.0) - #909 by SweetPea11

Thanks for the tip, I’ll give it a try.

Worked well - manually dialed down gain to approx. 30 to get the RSSI of the aircraft in the runup area down under -5 (originally around -1). Lowest RSSI was around -40.

What’s the lowest RSSI level the SDR can receive from an aircraft?

At the airport, I was picking up aircraft with the RSSI around -40, at home the lowest is around -30 which makes me think other houses/obstructions are blocking the more distant aircraft with their RSSI in the -30 to -40 range.

Is -40 the typical lower limit for these SDRs?

Often mostly depends on the noise.

So depending on the gain setting, the noise will also be at a different level.
If you reduce the gain the lowest RSSI will go down, up to a limit.

I’d suggest you reduce gain to test the limit yourself.

Theoretical limit is that the ADC only is 8 bit, that’s 256 values.
6 dB difference is a halfing or doubling of the voltage detected, at least that would mean -48 dBFS is the the theoretical limit for the signal being literally the lowest value of the ADC.

But then the ADC has some noise, so effectively you might only have around 7 bit.
Which means the lowest value would be around -42 dBFS.

Not an expert though.
Now while you might be able to receive aircraft at -40 dBFS it still might make sense not to turn the gain down so far.
Because you are already losing some messages in the ADC noise.

That’s why you turn the gain up like described in the 2nd message of this thread.
If you are not losing messages because the signal is too strong, there is no downside to having the gain that high.
The difference in message count to lower gain might be small though.

So if you want all the local planes, running the percentage mentioned at the start of the thread at 0.5% makes sense.
And if you have planes literally buzzing your antenna you might even have to reduce gain a bit further.

How does one remove autogain, once a suitable setting is reached?

Automatic gain optimization for dump1090 fa · wiedehopf/adsb-wiki Wiki · GitHub

If you have the current version though, it shouldn’t restart dump1090-fa or do anything unless the percentage goes out of the range of 1 to 5 percent for a day.

But you may remove it of course to continue some manual tweaking or to make sure the gain doesn’t change anymore :slight_smile:

I installed wiedehopf’s autogain script and it adjusted my gain downwards twice in a row. It wasn’t obvious that there was much change other than the decrease in number of peak strength signals, so I decided to do a little digging to see if I could get some more solid data.

I added the graph showing the ADS-B message rate per aircraft when I first set up the collectd service as a way to see how well the receiver is discriminating overlapping signals, since ADS-B doesn’t use any collision prevention and aircraft just talk over each other without checking if the frequency is clear. (AIS used on ships actually uses a self-organising time division to prevent cross talk, but transmits at a lower rate).

It’s quite hard to compare the receiver performance independent of time, since the collectd graphs only allow the creating of time-series graphs. That’s nice for showing trends, but if you want to see performance under similar circumstances it’s quite hard to evaluate.

Fortunately, rrdtool allows the extraction of data for a specified time range and that can be used for analysis elsewhere.

I extracted a period of the last full 24 hours using the newly set gain (38.6), and a complete period of 24 hours using the previous gain (42.1). The commands used for this were:

rrdtool fetch /var/lib/collectd/rrd/localhost/dump1090-localhost/dump1090_aircraft-recent.rrd AVERAGE -e 12am 27/06/2019 -s end-1day > aircraft.txt
rrdtool fetch /var/lib/collectd/rrd/localhost/dump1090-localhost/dump1090_messages-local_accepted.rrd AVERAGE -e 12am 27/06/2019 -s end-1day > messages.txt

Run these twice, adjusting the dates and file names to get the 2 data series.

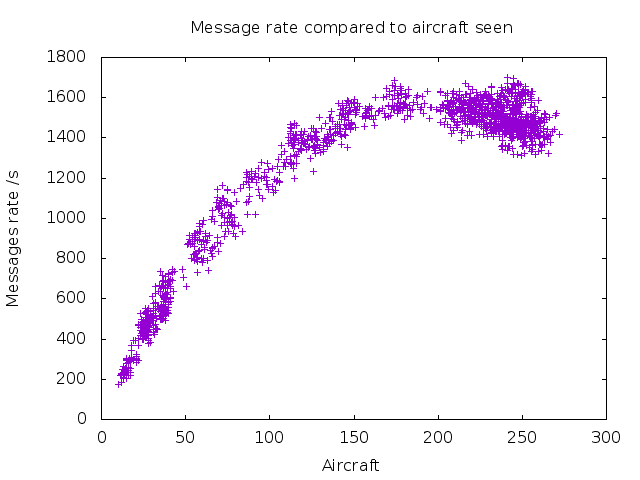
I imported this data to excel and plotted it, adding polynomial trend lines:

The new gain setting of 38.6 appears to show a clear improvement in messages received per aircraft over the previous setting of 42.1.

One observation is that there are fewer data points from the previous setting, due to how the rrd data is stored - it loses resolution for older data, being one data point for every 3 minutes rather than for every minute. No actual data is lost however, since the figure is an average of the past 3 minutes. In this application the difference isn’t big enough to matter.

This also shows the major limitation in performance of the RTL dongles - as the number of aircraft increases, the ability of the decoder to discriminate crosstalking aircraft is reduced, falling off sharply over 200 aircraft. I would expect a receiver with higher dynamic range and better sample rate such as an airspy to do much better here.

It would be really good to be able to automate production of a graph like this - I don’t really have the programming skills to do it, but it doesn’t look like it would be too difficult for someone who knew what they were doing.

Edit:- actually it looks like it’s easier to process this output than I first thought, so I’ll have a go at knocking something up.

5 Likes

You could make that a cronjob to get the more granular data.

Save it to $(date -I)-aircraft.txt to automatically assign the appropriate date.

A crontab line could look like this:

58 23 * * * /bin/bash -c "rrdtool fetch aircraft.rrd AVERAGE -s end-1day >/var/tmp/scatter-data/$(date-I)-aircraft.txt"

Executed 2 minutes before the day is over and saved to the appropriate filename.

To add such a cronjob just use sudo crontab -e.
(then it’s executed as root)
You can also do this as user pi of course.
So just crontab -e as user pi might be better.
Then you should choose a directory somewhere in your home directory.

I’m using root all the time anyway so i did it like this:
sudo crontab -e

58 23   *   *   *     /bin/bash -c "rrdtool fetch /var/lib/collectd/rrd/localhost/dump1090-localhost/dump1090_aircraft-recent.rrd AVERAGE -s end-1day >/var/cache/fetch/$(date -I)-aircraft"
58 23   *   *   *     /bin/bash -c "rrdtool fetch /var/lib/collectd/rrd/localhost/dump1090-localhost/dump1090_messages-local_accepted.rrd AVERAGE -s end-1day >/var/cache/fetch/$(date -I)-messages"

And created the /var/cache/fetch directory of course :wink:

Edit: forgot to mention, for rrdtool fetch i’m not specifying the end time to make it default to “now”.

Yes that would work, though in fact I was looking at reducing the output for the recent data rather than increasing the granularity of the older. It makes for a very cluttered graph otherwise.

I’ve worked out how to process the data into a form that makes it easy to generate a plot with gnuplot:

adsb

Now I just need to put it in a script.

I’m not sure how to incorporate your daily data extraction using dates however - I was going to do it for the previous 2 days, which is relatively easy in the RRD command line, but it might be more useful to have the ability to collect a few weeks data and be able to selectively draw charts from it.

Just make the script so that it takes dates in standard form as an argument.

So for example:

./script.sh 2019-06-29 2019-06-22

This would be to compare the 29th and the 22nd.
In the script you can use $1 and $2 to represent the arguments.

The 4 filenames would be expressed in the script like this:

"/var/cache/fetch/$1-aircraft"
"/var/cache/fetch/$1-messages"
"/var/cache/fetch/$2-aircraft"
"/var/cache/fetch/$2-messages"

Is that what you were asking?

Yes, makes sense. That should make it reasonably simple.

Is there a way to use the current date, or date-1 as an input for example, so to take the most recent file and the preceding one?

$(date -I --date=yesterday)

I’ll check what -4 days for example would be.

$(date -I --date='-4 day')

If you want to translate -4 and -7 as arguments to dates:

$(date -I --date="$1 day")

So $1 is the first argument, you’d have to use -4 or another negative number.
This of course simplifies the input.

1 Like

Thanks, I’ll have a play.