Had my HabAmp in for about 48 hours now, results are looking good, wit c30% improvement in all the key areas!
I’m in the process of reducing gain - currently have to the “top 30.x” setting (I forget which, not near Pi to check).
Currently getting Peak Level around -1.1, which is too high (I’m aiming for c-3db).
Couple of questions regarding tweaking gain:
I started from the top (44.5) and am tweaking down. Is it better to go down like this, or UP, from zero?
How long should each setting be tested for? ( I currently let each setting run for 24 hours, comparable for HourOfDay, but arguably not for DayOfWeek?)
Also, I recall there was a branch of Mut that automatically tested different gain settings itself, is that still available / in use?
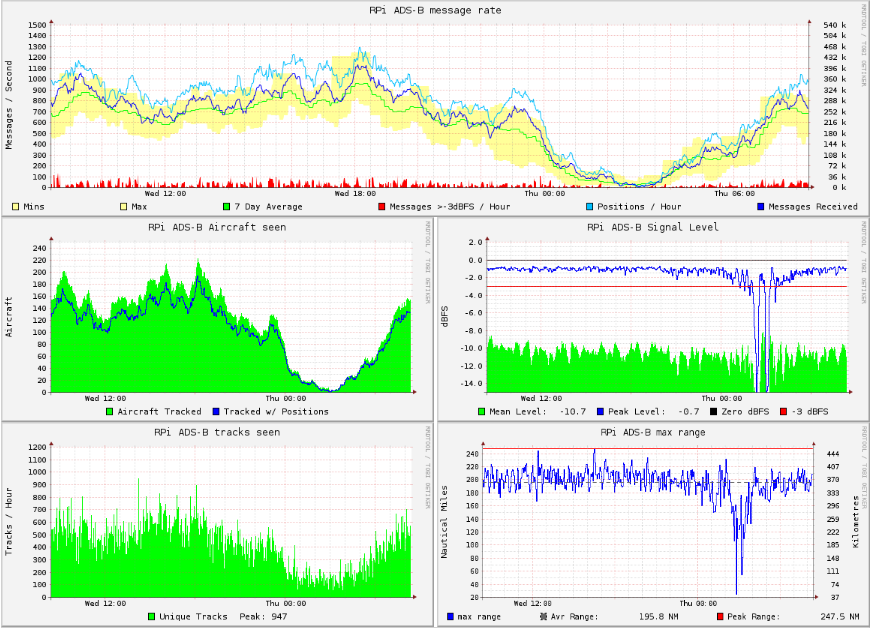
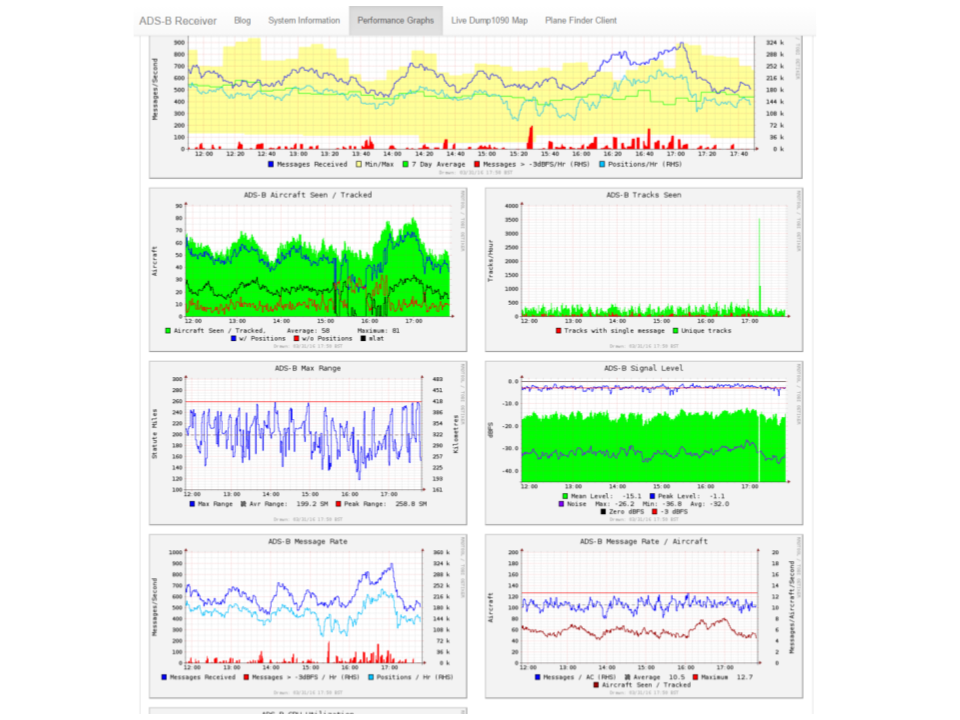
You could probably tweak every 10-15 minutes for the initial dial-in. Watching the collectd graphs for hourly stats I can usually see a difference almost immediately. I have the exact same setup at two different locations. They behave radically different when it comes to tuning gain, but the daily graphs look almost identical when they are set at their optimal gain. My first feeder is under tree cover 15 feet above ground and requires almost full gain (44.5). Each gain step shows a slight amount of change. My second feeder is in open air 50’ above the ground on a tower, and is very finicky when it comes to gain. It does best around mid gain (25.4). One step to high or low and the stats drop off drastically. What I have noticed on both my feeders is they are operating best when the “Messages > -3dBGS/Hr” is just noticeable on the 24 hour graph. Here are two examples from my “dialed in” feeders that are 20 miles apart. The first is under tree cover, and the second is up on a tower.
AFAIR, enabling (dump1090?) AGC through setting --gain to “-10” was considered as poor an idea as --gain=“AGC”?
Also, one thing I cant get my head round (going boss-eyed trying to figure this out! ) is surely the gain targets of aircraft, message rate etc etc depend on how many aircraft are actually around?
So one might believe a higher volume of aircraft - say, commuter traffic on a Monday morning - would generate higher results / goals, but be more related to the DayOfWeek, HourOfDay considerations rather than a particularly sweet gain setting?
I take it that isnt the case, hence the 10-15 mins for getting initial indications of gain setting impact…
cy80rg,
It’s learning in progess… I have two feed lines and feeders at my primary site that allows me to do side-by-side comparisons. At first I was just watching the Dump1090 screen and watching the number of planes on the screen and how far out they were. Make a change on one feed line or feeder at a time, see which one looked better. With the addition of the performance graphs, it made it easier to see the changes over time and more reliably measure the impact each change made. The top graph “RPi ADS-B Message Rate” gives me the best overall picture of whether a change has a positive or negative impact. Based on what I have seen with many different configurations, the red “Messages > -3dBGS/Hr” in your 24 hour graph seems to be very high indicating you would benefit by dropping the gain. If you look at both of my graphs, you can see that there is some red, but it is between 50-100 on the left scale and < 36k on the right scale. The “ADS-B signal level” should not be flatlined at the top. There should be variation and be between the black and red lines during the busiest times of day.
Make a change to GAIN in /etc/default/dump1090-mutabillity
sudo /etc/init.d/dump1090-mutabillity restart
Wait 10-15 minutes
Look at Collectd 1 hour stats
rinse
repeat
It looks like you get more messages and aircraft in the tree than on the mast. Why is that? Different antennas/amps? (Or are the two locations far apart? )
Excellent question, and I have only theories at this point. My best guess is that there is some other signal that needs to be filtered out that is causing interference. The gain jumps by huge amounts at the midpoint compared to at the higher levels too. Both setups are identical. Pi2 → Thumbnet R820T2 dongle → Power inserter → feedline → Paladin 20db satellite amp with high pass filter → 8 segment COCO. Both rigs were providing nearly identical results when set up side by side at my primary site with the same gain settings. After moving one to the tower site 20 miles (32Km) away, I was baffled by almost no plane counts. After reviewing the collectd graphs, it was obvious that there was TOO MUCH gain at the new site. I then started dropping the gain until the results got better.
Here is an example where I just changed the gain from 25.4 to 28 (1 step) and you can see a big drop off in received messages and distance as well as an increase in CPU utilization.
It goes to show that each site is unique and must be individually tuned for best results. I have a ceramic filter that I would like to try at that site. It does horrible things to my counts at my primary site, but may be the perfect thing for this site.
In my case, it is out of date, I have a test feeder with all the latest and greatest, but have not moved it to my “Live” feeders yet. Need to figure out how to preserve my collectd data when starting with a fresh image before I do the migration on my “live” systems.