MAX ADS-B Range

First post on this forum, so I’ll try to be short.
I searched for a similar post, but couldn’t find any.

What is the maximum range you seen on your receiver?

Here in west Greece, we have received air-crafts up to 890Km away, due to tropo ducting mostly, but normal coverage is at about 200NM


Wow. I’m impressed!

My record is in the 240-300mi range, probably closer to 240mi. A large hill and some nearby buildings block most of the long-range signals low on the horizon, but there’s a small gap that can see the horizon. Occasionally distant planes fly through that gap and PiAware picks them up.

A colleague of mine is interested in having me put a receiver site at the nearby astronomical observatory, which is situated on top of a tower on a large hill with no obstructions to the horizon. I ordered the FA antenna to mount on the mast there, so hopefully I can get better performance there. We shall see.

Due to obstructions, I don’t get a full 360-degree coverage of the sky, but according to my FlightRadar24 statistics page, my max distance is 225 nm a day. There was one special day that it reported 250 nm – which is over 460+ kilometers :slight_smile:

I’ve hit 347 miles on my radarcape, however on an average day I am at about 270 miles

You are right. In my case i have some building that obstruct my antenna, dont have 360°

1 Like

On fr24 statistics page there is a max distance limit of 329nm. I asked them and they said the max is 350nm. Go figure…
It would be nice to have a daily Max Range statistic added to our feeder stats here also.

Maximum range limit is set by curvature of earth. Assuming earth a perfect sphere and terrain perfectly uniform, the max range is about 450 km / 250 nm. Thaking into consideration the microwave bending through the layers of air, the maximum possible range is slightly larger and is 500 km / 300 nm.

The actual maximum range depends on terrain (hilly or level ground, natural/man-made obstructions, etc) and is less than ideal value given above.

The method to plot the maximum possible range curve at your location, based on terrain around you, is given in my post #1125 in Planefinder forum “ADS-B DIY Antenna”:

http://forum.planefinder.net/posts/1125/

Update: the gear on the tower is installed and working. My max range was ~350 miles, but that was evidently a one-off event from a single plane that I tracked for a few minutes. More typical max ranges from the new location are around 300 miles.

Well, sometimes nature helps us achieve more than we previously thought.
Thanks to Tropospheric ducting we can “see” far beyond the horizon sometimes…

go to heywhatsthat.com
do a new panorama
accurately place the cross hairs on your antenna locatio and set your antenna height
give the plot a name.

Once you have the plot - select “in the air”, set the boxes at the bottom to 10000 and 38000, then zoom out

This will give you a plot of what would be a reasonable range to receive taking hills, etc. into account (but trees and buildings are not considered … they do block the signal)

Checked my Fr24 stats page after a few weeks and the receiver is tracking planes that are 350 nm+ from my location;furthest point was 388 nm.

Does weather affect the range ?

In the aeronautical standard propagation model typical of VHF, UHF & Microwave frequencies, free space propagation conditions are assumed when the transmitter and the receiver are within the distance to the radio horizon (line of (radio) sight).

The distance to the radio horizon (4/3 Earth radius) can be calculated using following equation.

Drh=1.23 (√Htx) … (1)
where
Drh: the distance of the station to the radio horizon (NM)
Htx: the height of the transmitter above the Earth’s surface (feet)

Note: The same formula can be used to calculate the radio horizon of the receiver by substituting the height of the transmitter with the height of the receiver.

Applying this formula to both the transmitter and the receiver (e.g. between an airborne transmitter and an airborne receiver) formula below can be used for the calculation of the distance to the radio horizon between the transmitter and receiver.

Drh=1.23 (√Htx + √Hrx) … (2)

where
Drh: the radio horizon separation distance between the transmitter and receiver (NM)
Htx: the height of the transmitter above the Earth’s surface (feet)
Hrx: the height of the receiver above the Earth’s surface (feet).

It should be noted that the propagation of radio waves, typical of VHF, UHF & Microwave frequencies, is subject to a number of additional conditions, compared to the free space propagation.

Refraction and ducting as described below can extend the range over which this propagation model is applicable:

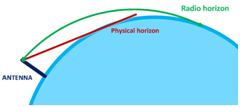
Refraction – Gradual changes in the refractive index of the [standard] atmosphere with altitude causes the bending of radio waves slightly towards (or in some cases away from) the Earth. The effect is that radio waves can propagate beyond the physical horizon to and can be received up to a distance which is commonly referred to as the radio horizon as shown in Figure 1. Along this path no other (significant) losses than the free space propagation loss between the transmitter and the receiver has to be considered. Variations in the refractive index of the atmosphere however cause the radio horizon to vary as well.The bending effect of refraction is corrected in radio propagation by calculation the distance to the radio horizonusing a 4/3 Earth radius. The 4/3 Earth radius approximation has been derived based on a standard atmosphere at sea level and is therefore not universally applicable. However, it is very widely used and provides a good approximation to describe the effect of radio path propagation globally.

https://farm6.staticflickr.com/5753/20296900424_fe935dd99a_o.png

Figure ‎1 - Radio Horizon versus physical horizon

Ducting – The change in refractive index is normally gradual, but under certain atmospheric conditions a layer, of warm air may be trapped above cooler air, often over the surface of water. The result is that the refractive index will decrease far more rapidly with height than is usual. The rapid reduction in refractive index (and therefore dielectric constant) may cause complete bending down, as illustrated in the Figure 2. The unusual atmospheric condition traps the radio waves in a duct. Extreme bending of the radio waves between the top of the atmospheric duct and reflection of the radio waves from the surface of the Earth may propagate the radio waves over extreme long distances (e.g. more than 500 NM). Other phenomena such as sand storm may also cause ducting of radio waves.

https://farm1.staticflickr.com/647/20298451923_6c44412b8a_o.png

Figure 2 - Propagation through ducting

.

I sometimes see really long spikes on my VRS range plot and wonder if they’re correct.

I’m thinking of writing a little script to log positions beyond 250nm or whatever, so I can verify them against FA’s tracklog. Also it’d be nice to have a scoreboard of the farthest-away flights I picked up. Has anyone written any logging tool like that?

@abcd567,
Don’t forget that the earth is not perfectly spherical.

scientificamerican.com/artic … not-round/

No pictures. vgvgvgvgvg jbjhjh

Just add the 19-charactor long [spolier][/spoiler] to complete count of 20 characters. When posted, it becomes invisible. Try it.

1 Like

[spoiler][/spoiler] ok, there it worked. Thanks. I’ve been reading all day so it wasn’t noticed. :slight_smile:

@BrianEwing
Sorry, typo.
[spoiler], NOT [spolier]

1 Like

Hello,

BTW I tried and couldn’t have it displayed in the lastest relase of dump1090-fa, are you aware of anything special compared to the method for mutability?

If you are trying to display the upintheair.json then yes. See:

1 Like